Tracking Price Levels: Practical Tools and Methods
Simple ways you can monitor inflation and track price changes yourself — from groceries to utilities to everyday purchases.
Why Track Prices Yourself?
You’ve probably noticed things cost more than they did six months ago. But how much more? And which items are rising fastest? That’s where personal price tracking comes in. It’s not complicated — you don’t need special software or training. What you’re doing is creating your own inflation snapshot based on what actually matters to your household.
The government publishes the Consumer Price Index (CPI) monthly, but it’s a broad average across millions of people. Your costs might move differently. Your family might buy more vegetables and less fuel. You might shop at specific stores with specific prices. Tracking your own numbers helps you understand your personal inflation rate — not just the national average.

The Basket Method: Your Starting Point
This is how statisticians do it — and it’s exactly what you can do at home.
Create Your Price Basket
Start with 15-20 items you actually buy. Don’t overthink it — pick things your household buys regularly. Rice, cooking oil, milk, bread, eggs, chicken, onions, tomatoes, coffee, tea, soap, shampoo, electricity (estimate), mobile phone recharge. Include both essentials and semi-regular purchases. This becomes your “basket.”
Record Baseline Prices
On one specific day (say, the first of the month), write down the price of each item. Include the quantity — price per kilo, per liter, per unit. Be consistent. If you bought a 1-kilo pack of rice for 45, record it that way. Don’t mix “per 500g” with “per kilo.” Store name matters too — prices vary between shops.
Repeat Monthly or Quarterly
Once a month (or every three months), check the same items at the same stores. Record the new prices. The consistency matters far more than perfection. You’re building a trend line, not a scientific study. After 6-12 months of data, patterns emerge clearly.
Calculate the Change
Math is simple. Take an item: rice was 45 per kilo in January, now it’s 48 in March. That’s a 3 increase, or 6.7% in two months. Do this for all items. Average the percentages. That’s roughly your personal inflation rate for that period. Don’t worry about getting the formula perfect — the trend is what matters.
Tools for Tracking: From Paper to Apps
Notebook & Pen
Honestly, this works fine. You don’t need technology for price tracking. A small notebook that you carry to the market, record prices as you shop, then transfer to a master list at home. Simple. Reliable. No batteries required. You’ll develop intuition about price changes just from writing them down repeatedly.
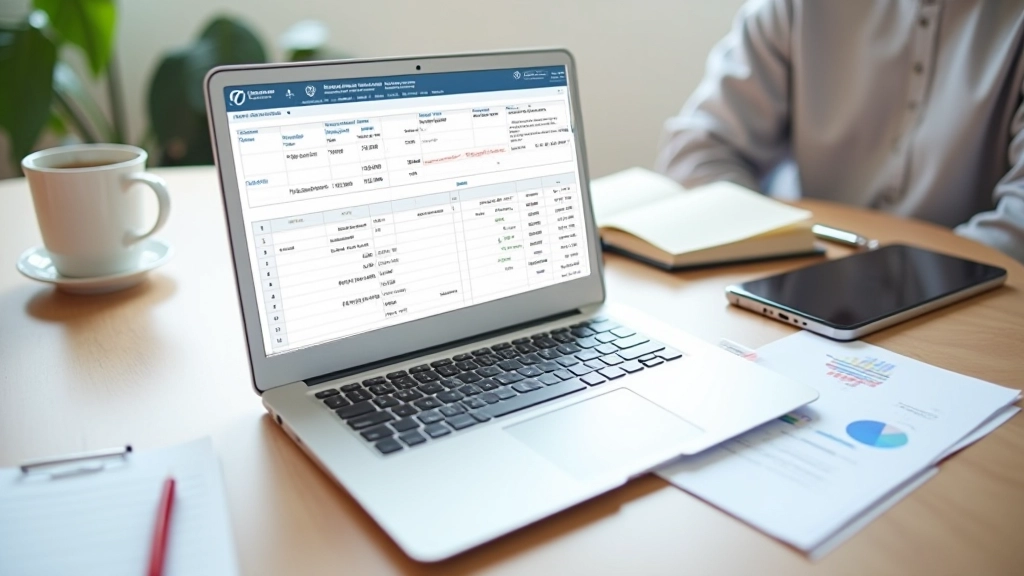
Spreadsheet (Excel or Google Sheets)
Once you have several months of data, a spreadsheet makes calculations automatic. Set up columns for Item, January Price, February Price, March Price, etc. Let the spreadsheet calculate percentage changes. It’s free, it’s flexible, and you can access it from your phone or computer. Google Sheets especially — it’s cloud-based and you can share it with family members.
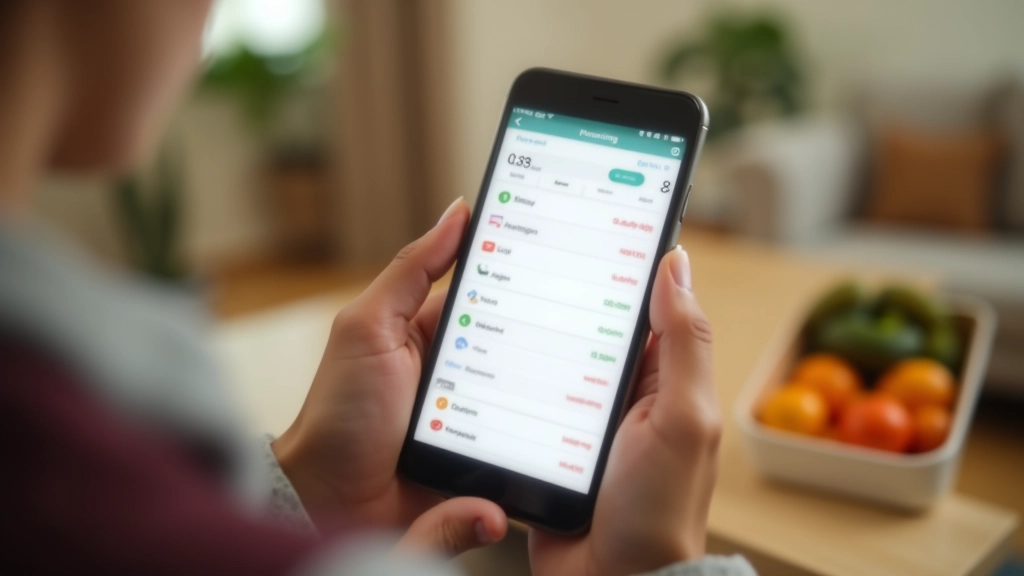
Mobile Apps (Budget Trackers)
Apps like Money Manager, YNAB (You Need A Budget), or even simple expense trackers can log prices. The advantage: you’re tracking spending anyway, so prices get recorded automatically. The disadvantage: most apps don’t show historical price trends clearly. You’re better off using them for expenses, not price tracking specifically.
Your Tracking vs. Official CPI: Understanding the Difference
You might find your numbers don’t match the CPI exactly. That’s expected — and it’s informative.
Your Personal Tracking
- 20 items you actually buy
- Your specific stores and locations
- Monthly or quarterly updates
- Shows YOUR inflation reality
- Easy to understand and maintain
Official CPI (Government)
- 500+ items across all categories
- Data from thousands of shops nationwide
- Updated monthly by statisticians
- Shows AVERAGE inflation across India
- Weighted by consumption patterns
Here’s the thing: if you buy lots of vegetables and oil, but the CPI is heavily weighted toward manufactured goods, your inflation might be 8% while CPI shows 5%. Both numbers are correct — they’re measuring different baskets. Your personal tracking answers the question that actually matters to your wallet: “Am I spending more on what I buy?”

Practical Tips for Consistent Tracking
Pick One Day Each Month
Don’t track randomly. Choose the 1st or 15th of every month. Same day, same store if possible. This consistency matters for comparing apples to apples. Seasonal price swings won’t confuse your trend line.
Track at Stores You Actually Use
Don’t compare prices at a luxury supermarket against a weekly market. Your basket should reflect where you shop. If you buy vegetables at the market and groceries at a shop, track both separately. You’re measuring YOUR inflation, not national averages.
Keep Your Basket Stable
Don’t swap items in and out of your basket frequently. You’re trying to track the same items over time. If an item disappears from shelves (seasonal produce), note it and handle it separately. Consistency beats perfection here.
Watch for Quality Changes
Sometimes prices stay the same but package size shrinks. A 50 soap that becomes 80g instead of 100g is effectively a price increase. Notice these shifts. They’re part of inflation that doesn’t always show up as a number increase.
Look for Patterns After 6 Months
Three or four data points might be coincidence. Six months starts showing real trends. Some items might be rising consistently (oil, dairy), others stable (packaged goods). This pattern is your personal inflation story.
Share Your Data with Family
If you’re using a spreadsheet, invite family members to view it (or edit it). They’ll see why household budgets need adjusting. It’s not abstract “inflation” anymore — it’s the actual price of milk going up by 5 per liter.

You’re Now a Price Tracker
This isn’t rocket science. You’re doing exactly what the government statisticians do — just on a smaller, personal scale. Track 15-20 items consistently. Record prices once a month. After a few months, you’ll see which categories are hitting your budget hardest. You’ll understand inflation not as a number in the news, but as the actual cost of living in your city.
And here’s the bonus: once you’re tracking prices, you’ll start spotting opportunities. Maybe oil’s rising fast — so you buy it in bulk. Maybe certain stores have better prices on certain items. You’ll make smarter shopping decisions just from knowing what things cost.
Start this week. Pick your 15-20 items. Write down prices today. Do it again in a month. That’s all you need. The inflation picture will become clear naturally.
“The best inflation tracker you own is already in your
pocket — your receipt from the market. Start saving
them. Start comparing them. That’s personal inflation
tracking.”
Informational Note
This article provides educational information about price tracking methods and personal inflation measurement. The techniques described are for personal reference and understanding only. Official inflation statistics are published by government agencies (RBI, Ministry of Statistics) and are based on comprehensive methodologies. Your personal tracking supplements but doesn’t replace official CPI data. Price changes vary by location, store, and consumption patterns. Use this information to better understand your personal spending habits and inflation’s impact on your household budget.